Visual Concept Explainers: Turning Complex Ideas into Clear Learning Experiences
Vipin Kumar
|
 20 November, 2026
Teachers do not usually struggle because they lack knowledge of the subject. The greater challenge is transforming that knowledge into an explanation every student can follow.
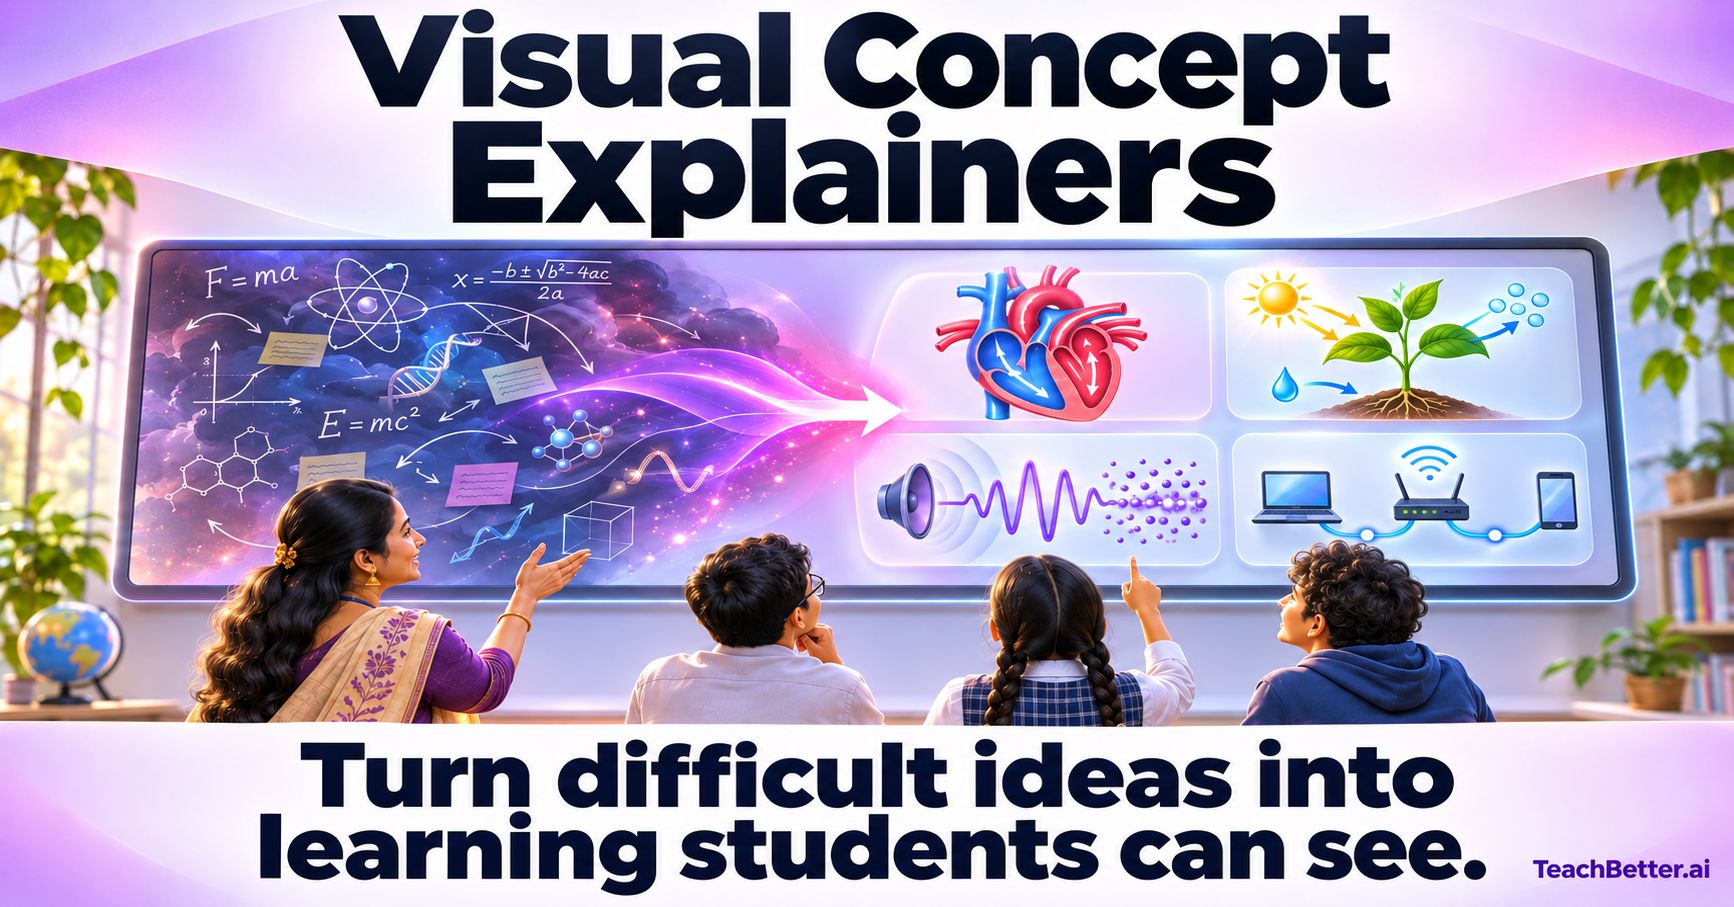
Some ideas are difficult to communicate through words and notes alone. Students may be asked to imagine how blood moves through the heart, how sound travels through air, how a plant produces food or how information reaches another computer.
The teacher may explain each part correctly, yet students can still lose the complete picture.
That happens because complex concepts rarely involve just one piece of information. Students may need to identify several components, follow a sequence, observe a relationship, compare two conditions and understand what changes over time—all within the same explanation.
Words arrive one after another. Complex ideas often need to be understood together.
TeachBetter.ai’s Visual Concept Explainer helps teachers close this gap by turning difficult processes, relationships and systems into clear, colourful and engaging educational visuals.
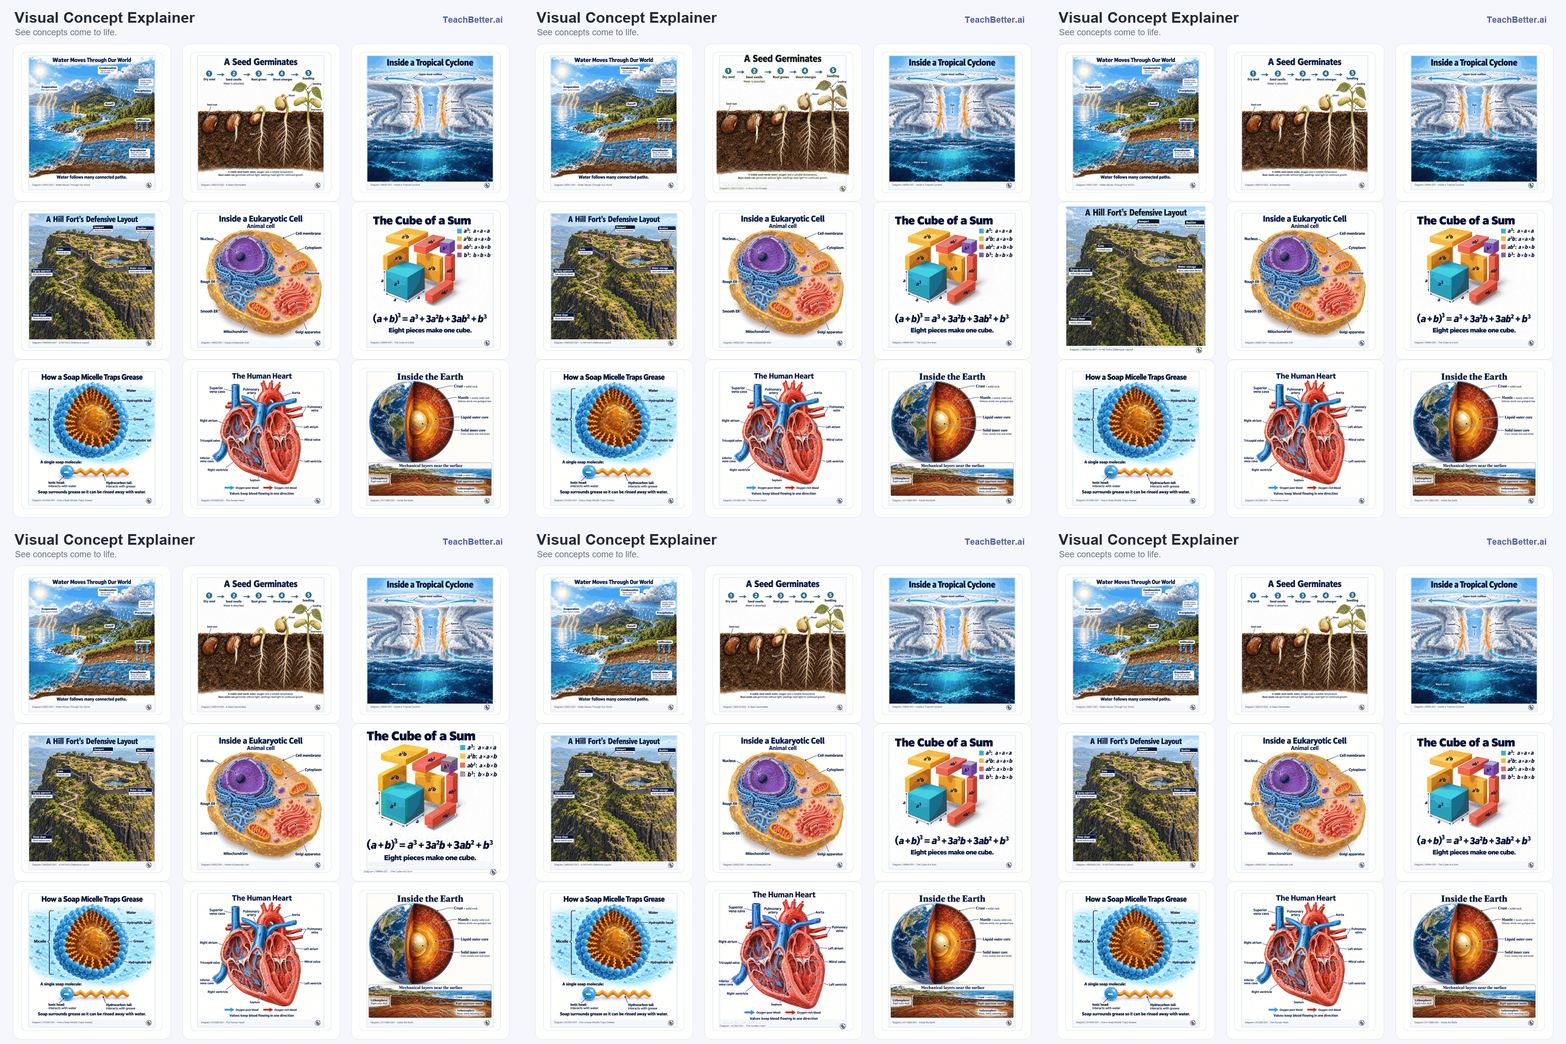
Teachers can search a ready-to-use collection across subjects and topics, select a matching explainer, personalise it with their school logo, school name and class details, and then download or share it with students.
The objective is not simply to make the lesson look more attractive. It is to help students see the structure of the concept they are trying to understand.
Why a Correct Explanation May Still Be Difficult to Understand
A teacher can provide all the correct information and still find that students have not formed an accurate mental model.
Consider sound waves. Students may learn that sound is produced by vibration and requires a medium through which to travel. The statement is correct, but it does not automatically show that air particles oscillate around their positions while a pattern of compressions and rarefactions moves forward.
Similarly, students may know the formulas for area and perimeter. They may still assume that two shapes with the same area must also have the same perimeter.
In both cases, the problem is not the absence of information. It is the difficulty of organising that information into a meaningful structure.
Different concepts create different forms of difficulty:
- A process may require students to follow several stages in the correct order.
- A system may contain multiple parts that influence one another.
- A comparison may depend on noticing one critical difference.
- A cycle may have no obvious beginning or end.
- An invisible mechanism may need to be represented before it can be discussed.
- A quantity may need to be shown in several equivalent forms.
- A change over time may require students to compare multiple states.
A visual concept explainer responds to the structure of the difficulty. It gives students a representation they can observe while listening, questioning and reasoning.
What Is a Visual Concept Explainer?
A visual concept explainer is an educational resource that organises a concept visually so that its essential structure becomes easier to understand.
It may reveal:
- How a process progresses from one stage to another
- How parts of a system interact
- What enters and leaves a process
- How two similar ideas differ
- How a quantity can have several equivalent representations
- What changes when one condition changes
- How an invisible mechanism produces an observable result
The visual organisation itself carries meaning.
Arrows show direction or movement. Colours separate pathways or categories. Numbered panels establish sequence. Cutaway diagrams expose structures that are usually hidden. Side-by-side representations make similarities and differences visible.
This is what separates a genuine visual explanation from a decorative image.
A photograph of a plant may make a science page attractive. A structured visual showing sunlight, water, carbon dioxide, chlorophyll, glucose and oxygen helps explain photosynthesis.
A picture supports the page. A visual concept explainer supports the thinking.
From Visual Aid to Visual Explanation
The term “visual aid” is often used broadly. It may refer to a photograph, illustration, chart, diagram or presentation slide. However, not every visual resource explains a concept.
An educational visual becomes explanatory when it helps students answer questions such as:
- What are the important components?
- How are they connected?
- In what order does the process occur?
- What moves, changes or remains constant?
- What causes the observed result?
- How does one representation relate to another?
A strong visual concept explainer reduces unnecessary distraction while making the essential relationship easier to notice.
TeachBetter.ai’s collection is designed around this purpose. The resources are not intended only to accompany the teacher’s explanation. They provide a structured framework through which that explanation can unfold.
Why Showing Strengthens Telling
Visual explanation does not replace the teacher’s voice. It gives that voice a shared reference point.
Without a visual, students may create different mental pictures from the same spoken explanation. Some may form an accurate model. Others may omit a stage, reverse a direction or connect the components incorrectly.
When the class has a clear visual reference, the teacher can direct attention to the exact relationship being discussed.
This can help teachers:
- Focus student attention: The teacher can isolate one part of a complex idea and discuss it before returning to the complete representation.
- Reveal relationships: Arrows, position and colour can show which elements are connected and how they influence one another.
- Make invisible processes observable: Particle movement, circulation, pressure changes and data transfer cannot be observed directly in an ordinary classroom. A visual model makes their logic available for examination.
- Compare ideas precisely: Students can inspect two representations side by side and determine what remains the same and what changes.
- Build a shared mental model: The class can refer to the same representation while discussing, questioning and correcting misunderstandings.
The visual gives students something stable to return to while the explanation becomes more detailed.
What Makes an Educational Visual Effective?
A visually impressive resource is not automatically an effective teaching resource. Educational visuals need to balance richness with clarity.
Several qualities matter.
A visible hierarchy: Students should be able to identify the main idea before examining the supporting detail. The title, primary diagram and most important relationship should not compete equally for attention.
A logical reading path: The visual should help students understand where to begin and how to proceed. Numbering, arrows, grouping and alignment can establish this path.
Purposeful use of colour: Colour should distinguish pathways, stages or categories. It should not be added only for decoration.
Accurate labels: Labels should be placed close to the correct structure or step. Students should not have to guess which object a label describes.
Controlled detail: A visual should contain enough detail to explain the idea without including every possible fact. Additional complexity can be introduced after students understand the core model.
A clear conclusion: Students should be able to state the main idea represented by the visual. A diagram that contains information but does not reveal its purpose may still leave them confused.
TeachBetter.ai’s ready-to-use Visual Concept Explainers give teachers a strong visual foundation. The teacher can then decide how much of the resource to introduce at one time and how deeply the class should examine it.
Visual Concept Explainer on TeachBetter.ai
Visual Concept Explainer is part of TeachBetter.ai’s new visual and interactive teaching capabilities. It extends the platform’s support beyond preparing teaching material to improving how concepts are communicated in the classroom.
A teacher can begin with the topic being taught and search the ready-to-use collection for a matching explainer. After selecting a suitable resource, it can be personalised with:
- The school logo
- School name
- Class details
- Other relevant classroom information
The completed resource can be downloaded for classroom presentation, incorporated into teaching material or shared with students for learning and revision.
This creates a straightforward workflow:
Search for the concept.
Choose the most relevant visual.
Personalise it for the class.
Use it to guide the explanation.
Download or share it for continued learning.
The teacher is not replaced by the resource. The resource gives the teacher a prepared structure around which a stronger explanation can be built.
Four Types of Complexity Visual Explainers Can Simplify
Different concepts need different kinds of visual treatment. The Visual Concept Explainer collection supports several forms of conceptual complexity.
1. Processes and sequences
Some ideas involve a series of events that must occur in the correct order. Students may understand each stage separately but lose track of how one stage produces the next.
Numbered panels, arrows and flow paths make the sequence easier to follow.
2. Systems and relationships
A system contains several components that influence or depend on one another. Understanding one component without seeing its relationship to the others can produce an incomplete model.
A system visual can reveal components, pathways, inputs, outputs and feedback.
3. Comparisons and distinctions
Related concepts are often confused because students focus on what they have in common. A carefully structured comparison highlights the difference that matters.
This is particularly valuable in mathematics and science, where a small change in structure or condition can produce a different result.
4. Invisible structures and mechanisms
Students cannot directly see air particles, data packets, pressure changes or the internal flow of blood. Visual models represent these mechanisms at a scale and level of detail appropriate for explanation.
The representation may simplify reality, but it gives students a reliable foundation on which deeper understanding can be developed.
Eight Concepts That Become Clearer When Students Can See Them
The TeachBetter.ai collection spans subjects, grades and different forms of complexity. The following examples show how visual structure can make difficult ideas easier to teach and understand.
1. Equivalent Fractions: Different Numbers, the Same Quantity
Equivalent fractions can be confusing because both the numerator and denominator change even though the quantity remains the same.
The visual uses strips of equal length divided into different numbers of parts. Students can see that one-half, two-quarters and four-eighths occupy the same proportion of an equal whole. A similar comparison shows that one-third and two-sixths are equivalent.
This allows teachers to explain not only that the fractions are equal, but why they are equal. The visual also reinforces an important condition: the wholes being compared must be the same size.
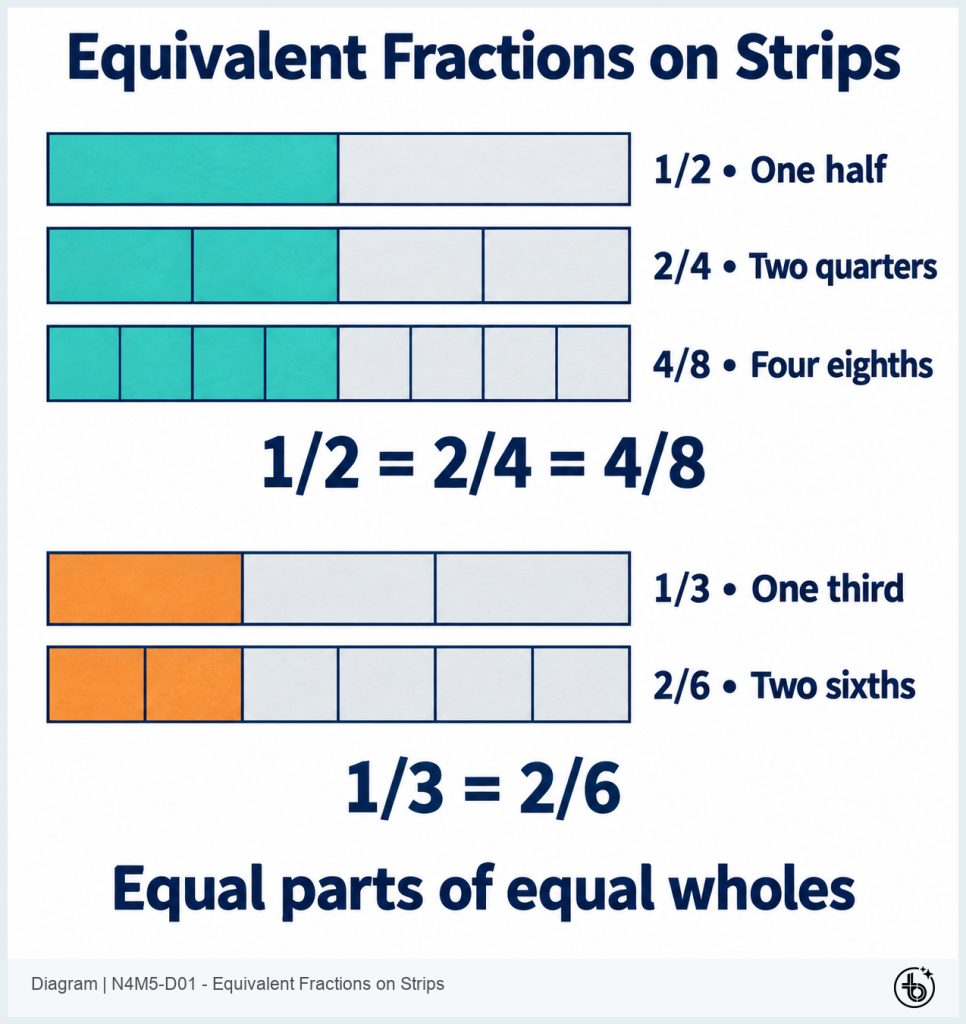
Equivalent fractions represented using equal-length fraction strips
Link: https://myspace.teachbetter.ai/view/resource/afe98040-6423-40dc-b1f9-34174f5f8ca7
2. Area and Perimeter: Same Space, Different Boundary
Students sometimes confuse area and perimeter because both are calculated using the dimensions of a shape.
The TeachBetter.ai diagram places two rectangles on a grid. Each covers 12 square units, but the lengths of their boundaries are different. The side-by-side comparison makes it clear that rearranging the same area can change the perimeter.
The visual allows teachers to move beyond stating that area and perimeter are different. Students can inspect the shapes, count the units and explain exactly why the results differ.
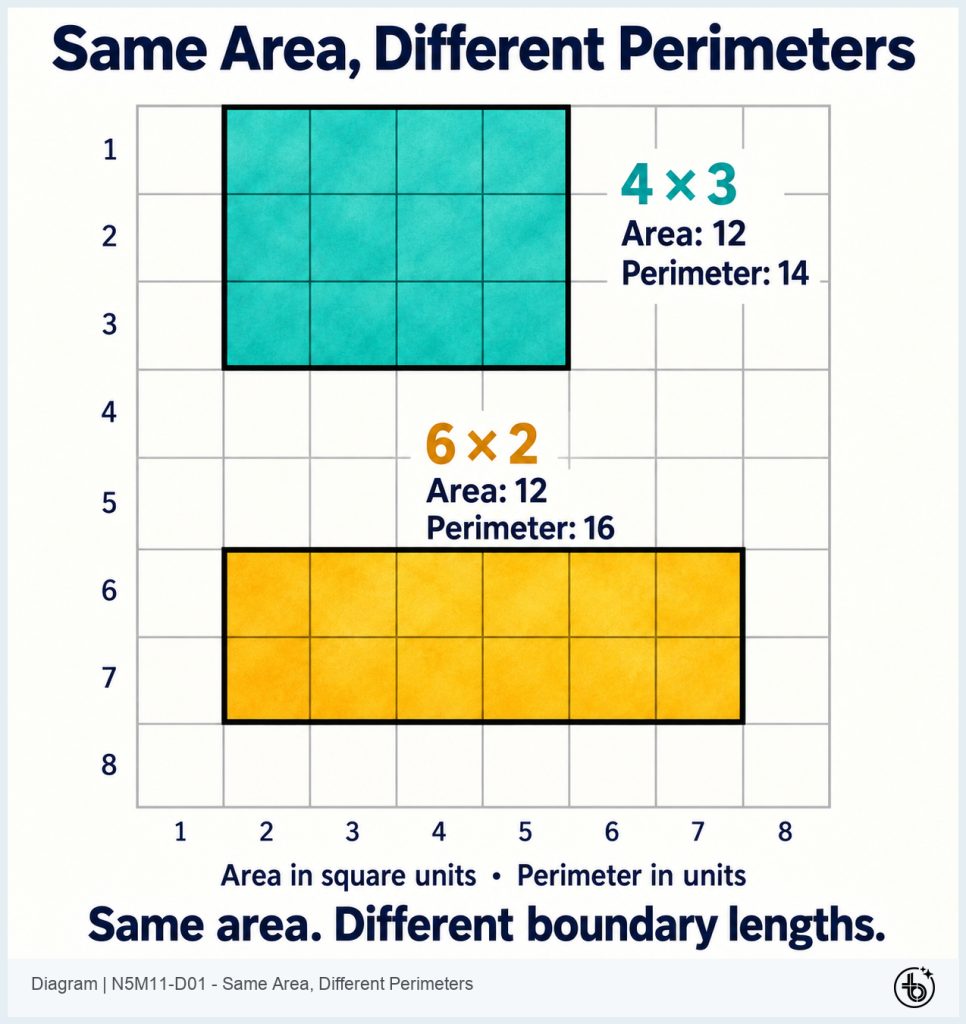
Two rectangles with the same area and different perimeters
Link: https://myspace.teachbetter.ai/view/resource/5c9ffd1e-cf38-40c5-8d31-8498d037656a
3. Photosynthesis: Connecting Inputs, Structures and Outputs
Students may remember that plants use sunlight, water and carbon dioxide to produce food and release oxygen. Understanding how the materials enter the plant and where the process takes place requires a more connected representation.
The visual shows water entering through the roots, carbon dioxide moving through the stomata and chlorophyll capturing light. It connects these inputs with glucose production, oxygen release and plant growth.
By placing the components within the complete plant, the explainer connects the chemical summary with the biological structures involved. Photosynthesis becomes a coordinated process rather than an equation to memorise.
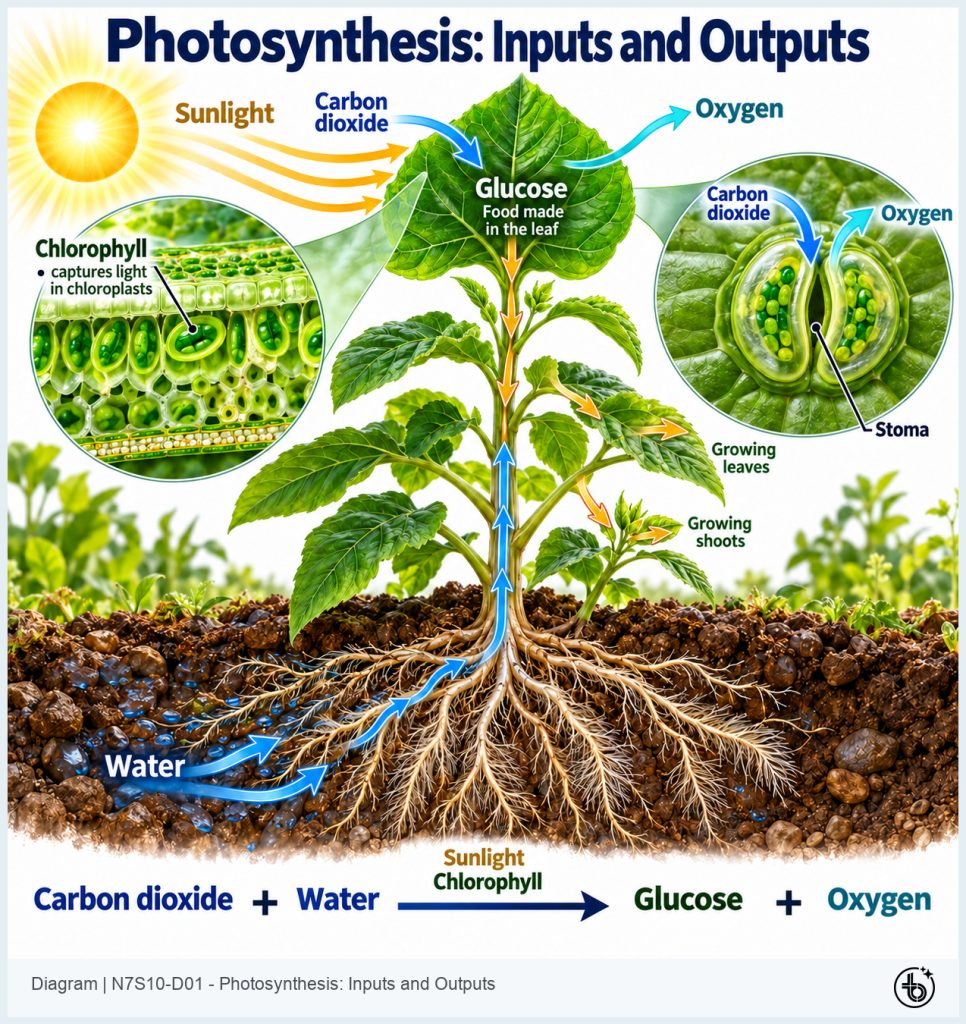
Inputs, structures and outputs involved in photosynthesis
Link: https://myspace.teachbetter.ai/view/resource/00aa2da9-1af8-4231-821e-23c9c22fb7eb
4. The Cardiac Cycle: Coordinating Valves, Pressure and Blood Flow
The cardiac cycle requires students to follow several changes at once. Chambers fill, ventricles contract, valves open or close, pressure changes and blood moves towards the lungs or the rest of the body.
TeachBetter.ai’s visual divides the cycle into stages while retaining the relationship between them. Colour-coded arrows show the direction of blood flow, diagrams identify valve positions and a graph connects pressure changes with different phases.
Teachers can focus on one stage before returning to the complete cycle. Students can trace what is happening and understand why a pressure difference causes a valve to open or close.
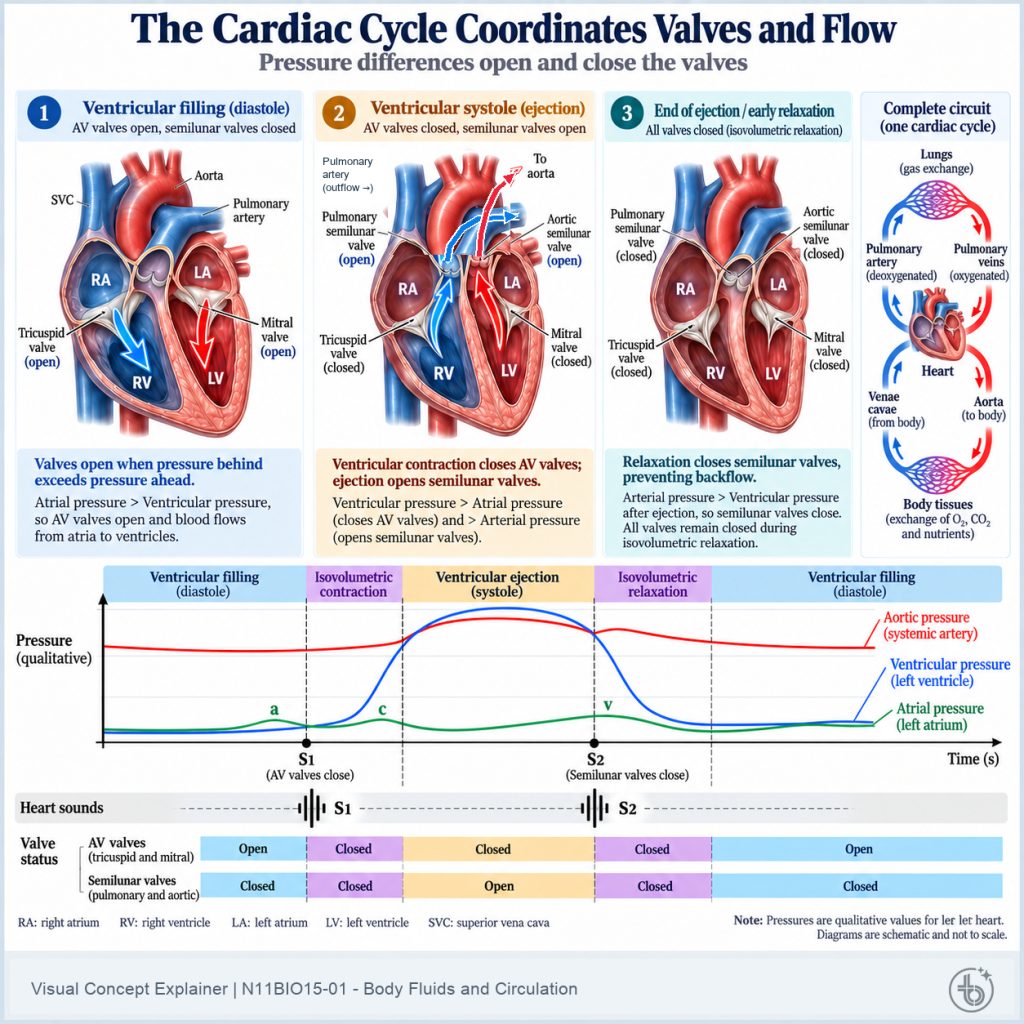
Cardiac-cycle stages showing valve positions, pressure and blood flow
Link: https://myspace.teachbetter.ai/view/resource/aeb91dfc-3b9e-40f4-9f9f-c5848d96ed93
5. Sound Waves: Showing How a Disturbance Travels
A common misconception is that air particles travel all the way from a sound source to the listener.
The visual shows a vibrating speaker producing compressions and rarefactions. Individual particles oscillate around their positions while the disturbance and its energy travel through the medium.
The particle representation is aligned with a wave graph, helping students connect pressure changes with wavelength and position. Teachers can use the explainer to distinguish the movement of particles from the movement of the wave pattern.
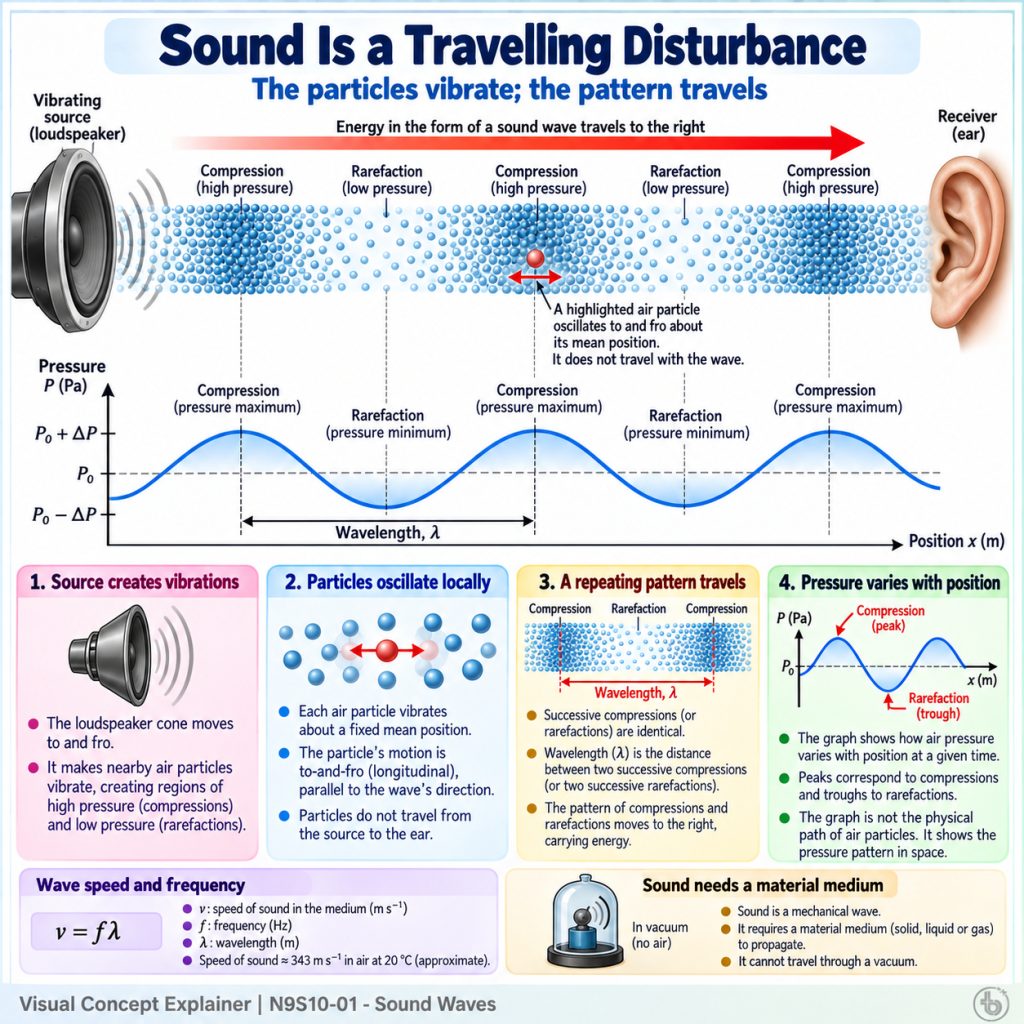
Sound travelling through compressions and rarefactions in air
Link: https://myspace.teachbetter.ai/view/resource/9fa12f60-5878-40ef-bd25-93f0990bdd51
6. Rooftop Rainwater Harvesting: Understanding a Complete System
Collecting rainwater may sound simple, but an effective rainwater-harvesting system contains several connected stages.
The visual follows rainwater from the roof into a gutter, through a filter and into storage. It also shows how overflow may be directed towards groundwater recharge and how stored water can be used.
Because the complete system is visible, students can understand the purpose of each component and trace the movement of water. The visual can support learning about water conservation, sustainability and community planning.
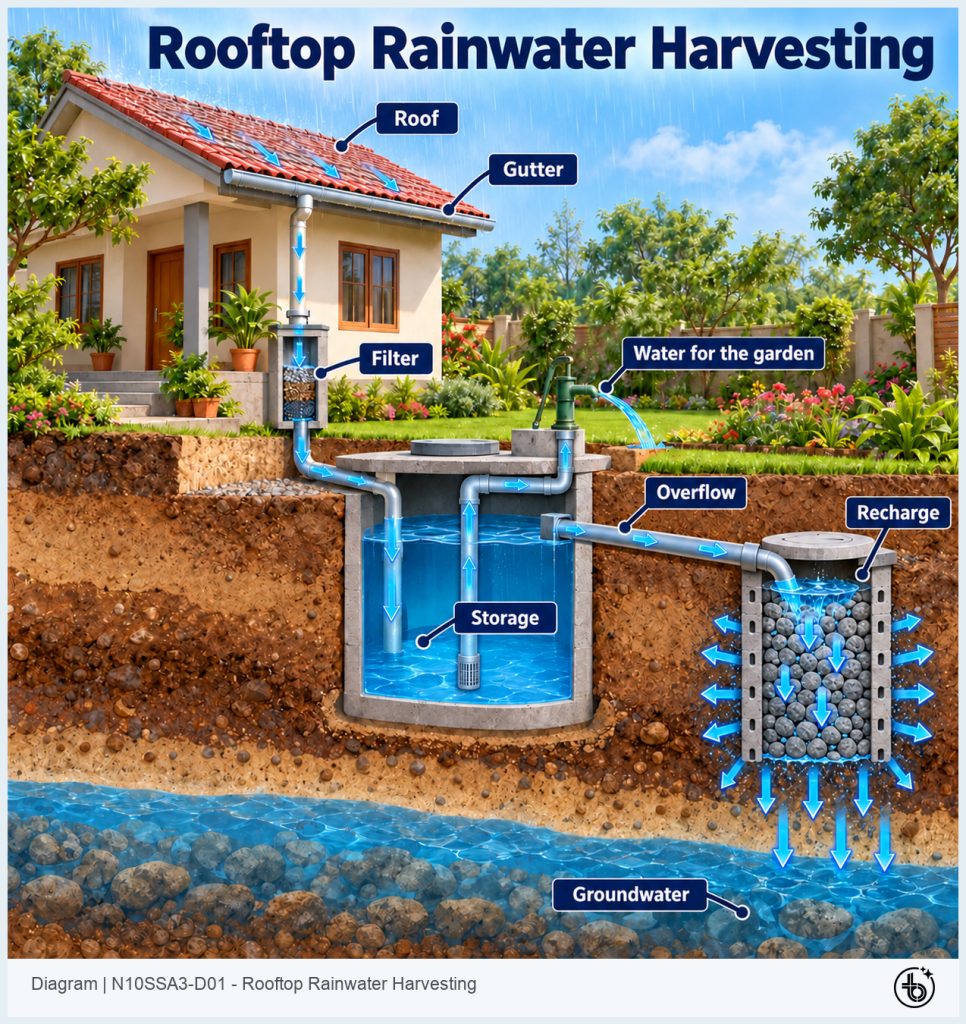
Rooftop rainwater-harvesting system showing collection, filtration, storage and recharge
Link: https://myspace.teachbetter.ai/view/resource/225c655a-3b44-4f07-9396-83ede1b04d8e
7. Computer Networks: Tracing How Data Reaches Its Destination
Students use connected devices every day, but data transfer remains largely invisible. Information appears to move instantly from one device to another.
The TeachBetter.ai visual shows how data can be divided into numbered chunks, sent through switches and routers, and reassembled at the destination. It also explains what happens when one chunk is lost and must be requested again.
Students can follow the complete journey while distinguishing between devices within a local network and routers that connect different networks. An unseen technical process becomes a sequence that can be traced and explained.
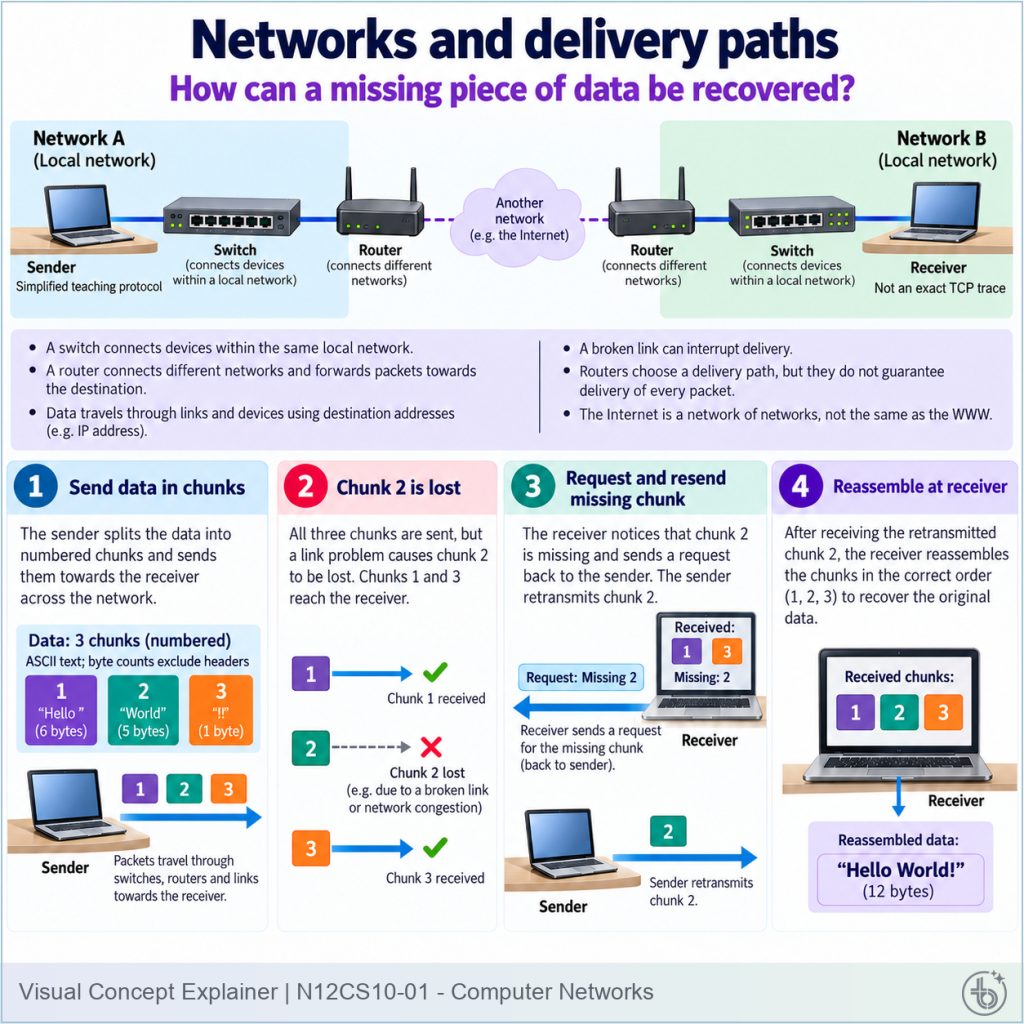
Data divided into chunks and delivered through network switches and routers
Link: https://myspace.teachbetter.ai/view/resource/36847ea4-ab1d-480a-8b66-745193214dc3
8. Natural Language Processing: Showing What a Text Representation Can Lose
Artificial intelligence systems cannot process language in exactly the same way people do. Text must first be transformed into a numerical representation.
The visual compares two sentences containing the same words in a different order. A simple bag-of-words representation counts the same words and produces the same feature vector, even though the meanings of the sentences are different.
By showing the sentence, tokens, word counts and final vector side by side, the explainer reveals both how the representation works and what it fails to preserve. Students can see why word order and context matter in language technology.
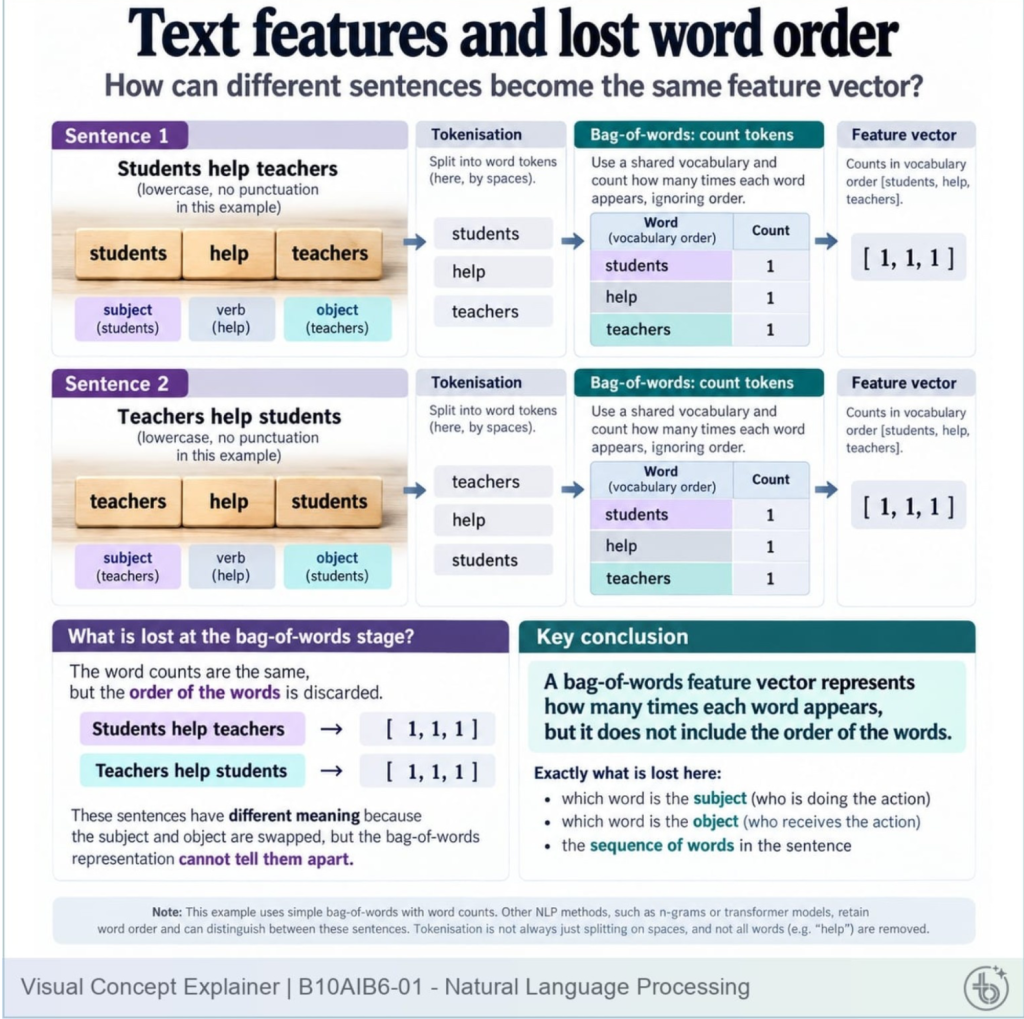
How bag-of-words represents sentences numerically and loses word order
Link: https://myspace.teachbetter.ai/view/resource/409082d1-7ba3-4477-90d4-cda3d4980446
A Practical Teaching Framework: See, Trace, Explain, Rebuild and Apply
A visual becomes educationally powerful when students do something with it. Teachers can use the following five-stage framework with a TeachBetter.ai Visual Concept Explainer.
1. See
Give students time to observe before beginning the full explanation.
Ask:
- What is the visual about?
- What do you notice first?
- Which parts appear connected?
- What do you already recognise?
This stage activates prior knowledge and helps the teacher identify students’ initial interpretations.
2. Trace
Direct students through the important pathway, sequence or comparison.
They might trace:
- Water through a rainwater-harvesting system
- Blood through the heart
- Data across a network
- Energy through a sound wave
- Inputs and outputs in photosynthesis
Tracing encourages students to follow the internal logic of the visual rather than treating it as a collection of labels.
3. Explain
Ask students to translate what they see into their own words.
The teacher can listen for missing stages, reversed directions or inaccurate relationships. Students demonstrate understanding by explaining the representation, not by reading its labels aloud.
4. Rebuild
Partially hide the visual, remove selected labels or ask students to sketch a simplified version.
Rebuilding requires students to recall the structure rather than merely recognise it. It also reveals which parts of the concept remain unclear.
5. Apply
Present a changed condition or new problem.
For example:
- What happens if a network chunk is lost?
- What changes if a heart valve does not close?
- Can two more shapes have the same area and different perimeters?
- What would happen to photosynthesis without sufficient light?
Application helps the teacher determine whether students can use the visual model beyond the original example.
Using Visual Explainers Across the Lesson
A Visual Concept Explainer can serve different purposes at different stages of teaching.
Before the lesson: Create a reason to learn
Display part of the visual and ask students what they think is happening. Their questions can become the starting point for the lesson.
During the explanation: Build the model gradually
Focus on one component or stage at a time. Avoid explaining every label immediately. Return repeatedly to the complete visual so students understand how each part contributes to the whole.
After the explanation: Make students do the explaining
Ask students to explain the visual to a partner, restore missing labels, identify an intentional error or answer a changed-condition question.
During revision: Use the visual for retrieval
Students can use the diagram as a prompt to reconstruct the concept. They can cover the labels, explain the sequence or reproduce a simplified version from memory.
For independent learning: Provide a reliable reference
A personalised explainer can be shared with students so that they have a structured resource beyond their written notes.
Preventing Passive Visual Learning
A polished visual can attract attention, but attention alone does not guarantee understanding.
If students only look at the image while the teacher reads its content, they may remain passive. The aim should be to make them interpret the representation.
Useful prompts include:
- What is this visual trying to explain?
- Where should we begin?
- What does this arrow represent?
- Which elements are inputs and which are outputs?
- What remains the same in both examples?
- What changes between the stages?
- Which relationship is most important?
- What misconception could this visual correct?
- How would you explain the concept without reading the labels?
- What question is still unanswered?
These prompts encourage students to move continuously between seeing and reasoning.
Using Visuals to Expose Misconceptions
One of the most valuable uses of a visual concept explainer is to make misconceptions visible.
Misconceptions are often internally consistent. A student may believe that air particles travel from a loudspeaker to the ear because that mental picture appears to explain how sound reaches a listener. Another may believe that a greater perimeter always means a greater area because that pattern appears in familiar examples.
A carefully designed visual can challenge the incorrect mental model.
Teachers can make this more powerful by asking students to predict before revealing the explanation:
- Do air particles travel with a sound wave?
- If two shapes have the same area, must they have the same perimeter?
- Do two sentences containing the same words always have the same meaning?
- Does all collected rainwater go directly into storage?
Once students have committed to a prediction, the visual becomes evidence they can examine.
The objective is not simply to tell students that an answer is wrong. It is to help them replace the misconception with a more accurate and useful model.
Developing Visual Literacy Alongside Subject Knowledge
Students encounter diagrams, maps, charts, interfaces and visual instructions throughout education and everyday life. Learning how to read a visual is therefore a skill in itself.
Teachers can help students recognise common visual conventions:
- Arrows may show movement, direction or cause.
- Colour may distinguish categories or pathways.
- Scale may be enlarged or reduced for explanation.
- A cutaway view may reveal something normally hidden.
- A graph and diagram may represent different aspects of the same process.
- A model may simplify reality to focus on one relationship.
Students should also learn to ask what a visual leaves out.
A model of sound does not reproduce every physical detail. A network diagram simplifies an enormous technical system. A diagram of photosynthesis represents the main inputs and outputs without showing every chemical reaction.
Understanding both the value and limitations of a representation builds stronger visual literacy.
Supporting Different Learners Through a Shared Reference
Students vary in reading ability, subject vocabulary, prior knowledge and confidence. A shared visual provides multiple entry points into the same concept.
One student may begin by identifying a familiar structure. Another may follow the arrows. A third may connect the diagram with a formula or technical term.
The teacher can gradually move the entire class towards a more precise explanation.
A visual can also reduce the amount of information students must hold in memory while listening. They can refer back to the representation instead of mentally reconstructing every component.
This does not reduce academic challenge. It allows students to direct more of their effort towards understanding relationships and reasoning about the concept.
Personalising Visual Resources for the Classroom
TeachBetter.ai allows teachers to personalise selected Visual Concept Explainers with their school logo, school name and class details.
The resources can be used in:
- Classroom presentations
- Printed visual materials
- Revision handouts
- Learning-management systems
- Digital resources shared with students
- Subject and departmental resource collections
Personalisation helps the resource feel integrated with the school’s teaching material.
Teachers can also place instructional support around the visual. A downloaded explainer can be paired with guiding questions, a short written task, an exit ticket or an application problem.
TeachBetter.ai provides the visual foundation. The teacher determines how the resource will serve the class.
Reducing Preparation Time Without Making Teaching Generic
Creating a high-quality concept explainer from the beginning can take significant time.
The teacher must decide what information to include, organise its hierarchy, source or create illustrations, verify labels, design the layout and ensure that the final resource remains readable.
TeachBetter.ai’s ready-to-use collection gives teachers a prepared starting point. Instead of spending most of the available time constructing the visual, teachers can concentrate on:
- Selecting the most suitable resource
- Deciding what students should notice first
- Planning questions
- Anticipating misconceptions
- Adapting the depth of explanation
- Designing an application or assessment activity
The resource improves efficiency without making the lesson generic. The teacher’s choices, explanations and interactions continue to determine how the learning experience develops.
What Visual Concept Explainers Offer Teachers, Students and Schools
For teachers: More ways to explain difficult ideas
Teachers gain a structured visual foundation for concepts that are hard to communicate through notes and speech alone. They can spend more time guiding understanding and less time constructing every resource.
For students: A clearer model of the concept
Students can observe relationships, trace processes and compare representations. They gain a reference that supports classroom explanation, independent learning and revision.
For schools: Greater access to rich visual resources
Schools can give teachers a consistent collection of high-quality educational visuals across subjects and class levels. Personalised resources can also support greater continuity in the materials shared with students.
The value is not simply better-looking content. It is the possibility of making conceptual clarity more consistent across classrooms.
Connecting Visual Explanation with the Wider TeachBetter.ai Platform
Visual Concept Explainer is one part of TeachBetter.ai’s broader visual and interactive learning experience.
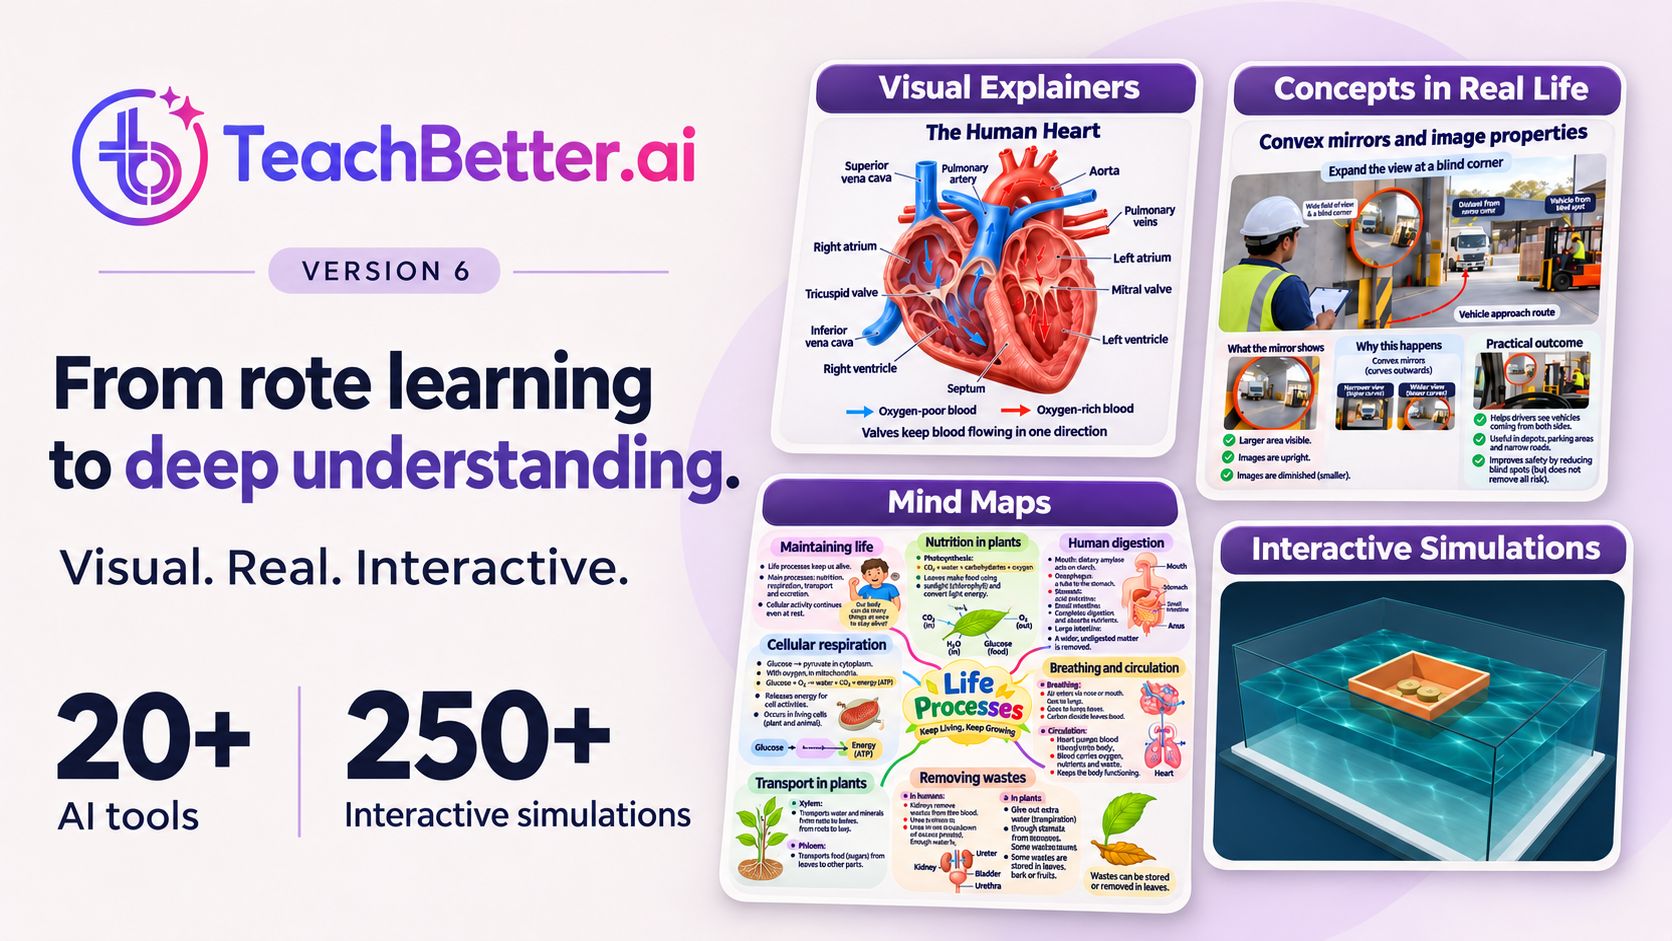
A teacher can use a Visual Concept Explainer to show how an idea works, Concepts in Real Life to demonstrate where it matters, a Mind Map to organise the main relationships and an Interactive Simulation to allow students to explore what changes.
TeachBetter.ai also brings these resources together with 20-plus AI tools for teaching support and PaperQR classroom assessments, which allow teachers to conduct in-class assessments without requiring every student to have a device.
This supports a connected learning journey:
See the concept.
Trace the relationship.
Connect it with life.
Explore what changes.
Organise the learning.
Check understanding.
Teachers can choose the capability that fits the learning need rather than forcing every topic into the same teaching format.
A Practical Starting Point for Teachers
Begin with a concept students regularly find difficult to explain in their own words.
Search for the topic in TeachBetter.ai’s Visual Concept Explainer collection and choose a visual that addresses the specific difficulty—a process, comparison, system, sequence or invisible mechanism.
Before using it, decide what students should notice first. Prepare two or three questions that guide attention towards the essential relationship.
During the lesson:
- Allow students to observe.
- Focus on one part at a time.
- Trace the important sequence or relationship.
- Ask students to explain what they see.
- Rebuild the complete model.
- Apply the model to a changed situation.
After the lesson, download or share the personalised resource so that students can revisit it during learning and revision.
A visual is most powerful when it does not simply give students more information, but helps them organise the information into understanding.
Frequently Asked Questions
What is Visual Concept Explainer on TeachBetter.ai?
Visual Concept Explainer is a TeachBetter.ai capability that provides clear, colourful and engaging educational visuals for explaining concepts across subjects and class levels.
How do teachers access the visual explainers?
Teachers can visit TeachBetter.ai, open the Visual Concept Explainer collection, search for a topic and choose a matching resource.
Can the resources be personalised?
Yes. Teachers can personalise selected resources with their school logo, school name and class details before downloading or sharing them.
Are visual explainers useful only for science?
No. The collection includes mathematics, science, social studies, computing, artificial intelligence and senior-secondary subjects. Visual explanation is useful whenever students need to understand a process, relationship, comparison, system or structure.
Do visual explainers replace teacher-led explanation?
No. They strengthen teacher-led explanation by providing a shared visual reference. The teacher still guides attention, introduces terminology, asks questions and addresses misconceptions.
Can Visual Concept Explainers support revision?
Yes. Students can use them to reconstruct a process, recall relationships, explain a concept and identify gaps in their understanding.
Can the resources support assessment?
Yes. Teachers can remove labels, ask students to trace a process, identify an error, explain a relationship or apply the model to a new situation. TeachBetter.ai’s PaperQR capability can also support classroom assessment without student devices.
How are Visual Concept Explainers different from Mind Maps?
A Visual Concept Explainer shows how a particular concept, mechanism or process works. A Mind Map organises the broader ideas and relationships within a topic.
How are they different from Concepts in Real Life?
A Visual Concept Explainer clarifies the internal logic of a concept. Concepts in Real Life shows where the concept appears or is applied outside the classroom.
How are they different from Interactive Simulations?
A visual explainer provides a structured representation of the concept. An interactive simulation allows students to change variables, test predictions and observe results. Teachers can use the two capabilities together.
Make Every Explanation Easier to See
Complex concepts do not always need longer explanations. Sometimes they need a clearer form.
TeachBetter.ai’s Visual Concept Explainer helps teachers transform processes, systems, comparisons and invisible mechanisms into structured educational visuals that students can observe, question and understand.
Teachers can find a relevant explainer, personalise it for their school or class, and use it for instruction, discussion, independent learning and revision.
Students gain more than a colourful image. They gain a model through which the concept can begin to make sense.
Turn difficult ideas into learning students can see.
Explore Visual Concept Explainers on TeachBetter.ai

Vipin Kumar, Co-Founder, TeachBetter.ai
Vipin Kumar is building TeachBetter.ai to create intuitive AI tools that simplify teaching and enhance learning outcomes. With prior experience at global technology companies, he brings a deep understanding of scalable systems, user needs, and practical digital solutions. His mission is to make AI adoption in education easy, affordable, and truly impactful for teachers everywhere. He is committed to creating AI solutions that save time, boost creativity, and empower educators to focus on what matters most—teaching.
Read other articles authored by Vipin Kumar here.